Wide Events vs. JSON Logs: What Actually Changes?
One JSON line says a request hit the rate limit, and another line holds the user ID. What would it take to answer “which users hit the limit” with a single query?
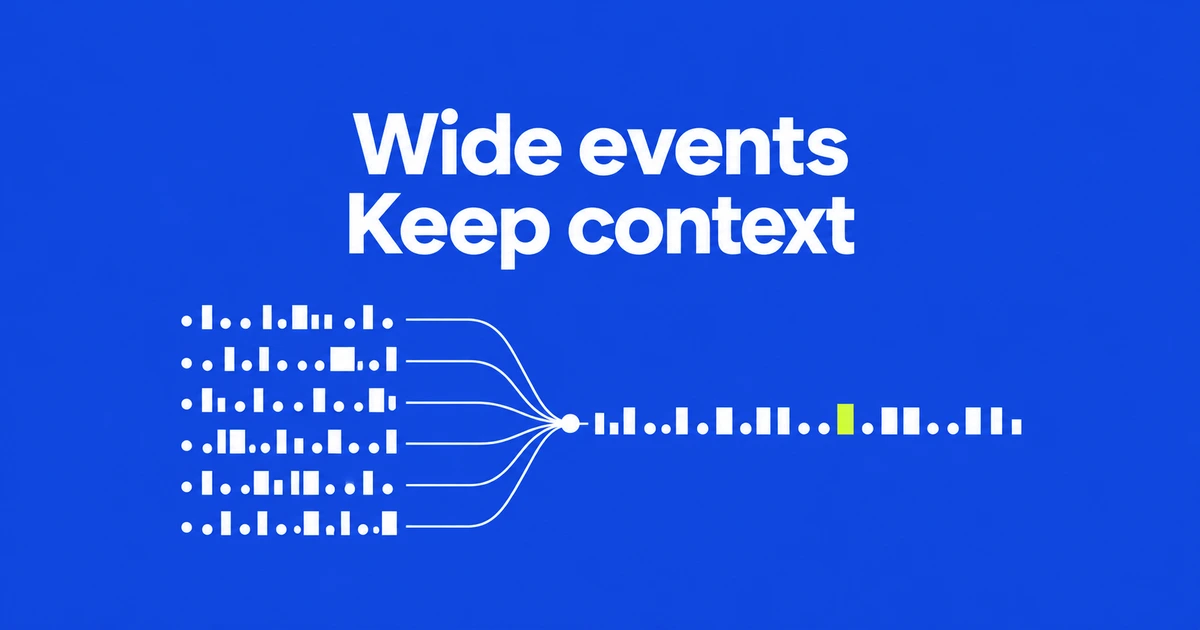
- A wide event collects the outcome and context of a unit of work. JSON is one possible representation.
- Keeping errors, versions and feature settings together makes them available for filtering and grouping.
- Existing logs or OpenTelemetry spans can carry the data; application-specific context still needs deliberate instrumentation.
The difference is what belongs in one record
A JSON logger can still scatter a request’s version, feature settings and final error across separate entries. A wide event brings that context together around a unit of work, so those fields can be queried together.
Ivan Burmistrov’s 2024 essay, recently resurfaced on Hacker News, argues for investigating rich events instead of organizing the discussion primarily around three separate telemetry signals. This is an instrumentation model, not a newly released serialization format.
Stripe’s canonical log lines show the practical distinction. A rate-limit decision and a user identifier on separate lines must first be correlated. Collect them in the request’s final record, and “which users were rate limited?” becomes a direct aggregation. Stripe retains ordinary logs alongside these records.
Go from an error spike to the affected conditions
With outcome and context together, you can group failures by version, filter to an affected version, then investigate another dimension. The following is an illustrative checkout example, not production measurements or a required schema.
| Context in the request record | Question it supports |
|---|---|
| Route and outcome | Which operation is failing? |
| Client version and OS | Is the problem concentrated in one combination? |
| Checkout feature setting | Do requests using the new flow behave differently? |
| Duration and error type | How do the slow requests end? |
Burmistrov illustrates this with advertising events: investigators narrow the data by campaign type, operating system and OS version. The value is being able to explore a combination that was not anticipated when metrics were designed. Finding a concentration identifies where to investigate; it does not by itself establish the cause.
OpenTelemetry already has a place for the context
OpenTelemetry spans support key-value attributes describing an operation. Their context includes trace and span identifiers. A span can therefore carry the version and feature context needed for this approach without replacing the tracing system.
In his implementation guide, Jeremy Morrell keeps a reference to the span wrapping a request and enriches it as work proceeds. That matters because entering a child span changes the active span. His main marker is a convention for locating these records, rather than a requirement of OpenTelemetry.
The application team still has to decide which business facts matter. Automatic instrumentation cannot infer the meaning of a new subscription tier or an experimental checkout flow.
A representative event can coexist with detailed logs
One rich request record does not require deleting other logs or child spans. It provides a useful starting point from which to follow the detailed execution.
Retention also needs a deliberate choice. Morrell discusses sampling when recording every request becomes too expensive. OpenTelemetry’s sensitive-data guidance calls for collecting only what serves an observability purpose; richer context is not a reason to copy credentials or session tokens into telemetry.
A practical starting point is one troublesome request path. Check whether outcome, version and feature context can already be queried as facts about the same operation. If they can, adopting the terminology does not require rebuilding the logging stack.